Martha C. Bean
Complexities Visualized & Resolved

Martha C. Bean
Complexities Visualized & Resolved

Mapping Processes
Ever seen a Gantt chart? A project management chart? Sure you have. But have you you ever used one to inspire and motivate your colleagues while simultaneously clarifying tasks and goals? I'm guessing not. Here are ideas for how to design and illuminate decision steps using imagery drawn directly from the creativity, insights and institutional knowledge of your group.

A process map to show decision steps.
Three National Forests were jointly revising regional land use and resource plans. The process was as complex as it was controversial. This process map illustrated these elements through time: how decisions would be made; who had ultimate authority for decisions; what information would be brought to the decision and who provided oversight at each key stage. The planning team, the public, and elected officials used this graphic to pinpoint where the project was at any given moment. A free-standing drawing of a bus, with the project team pictured inside, moved along the timeline as milestones were met. Moving the bus became a way to both mark and celebrate progress.

A process map to create a program.
A western state made a choice to improve health care delivery, well ahead of national health care reform. This process map was designed with project managers, elected officials and constituents in mind, and illustrated how they would build the program through analysis, public outreach and transparent decision making.

A process map to locate a public facility.
New wastewater management was needed, and would be a vast improvement over existing treatment. However, like any large public project, those closest to the plant would be impacted by physical changes. Leaders were committed to siting and building the plant to enhance the neighborhood with new open spaces, learning centers, habitat improvement and art. Working with the community, planners crystalized the process to realize this goal. This process map shows how they did just that.

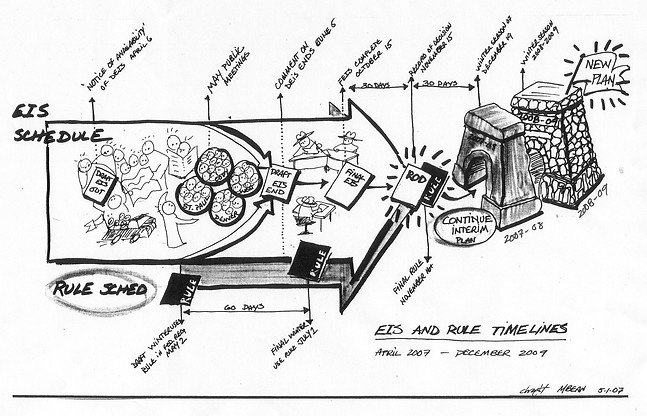
A process map to solve a problem.
A parkway connecting two National Parks was closed much of the winter, open only to vehicles that could travel on snow. Management of the parkway was a contentious issue. The Park Service needed to map out how they would conduct their problem solving with constituents, other agencies and within their own regulations. This process map readied the Park Service for that work, identifying where inputs occurred, where decisions were to be made, and how outcomes might lead to further challenges.
Connect with Me
206 • 947 • 1374
© 2019 Martha C. Bean
All Rights Reserved in All Media
Design by DeWriteSites
Data Protection | Cookies Policy